ORACLE^ USER MANUAL
Here is a documentation that explains in more detail everything that you may need to know.
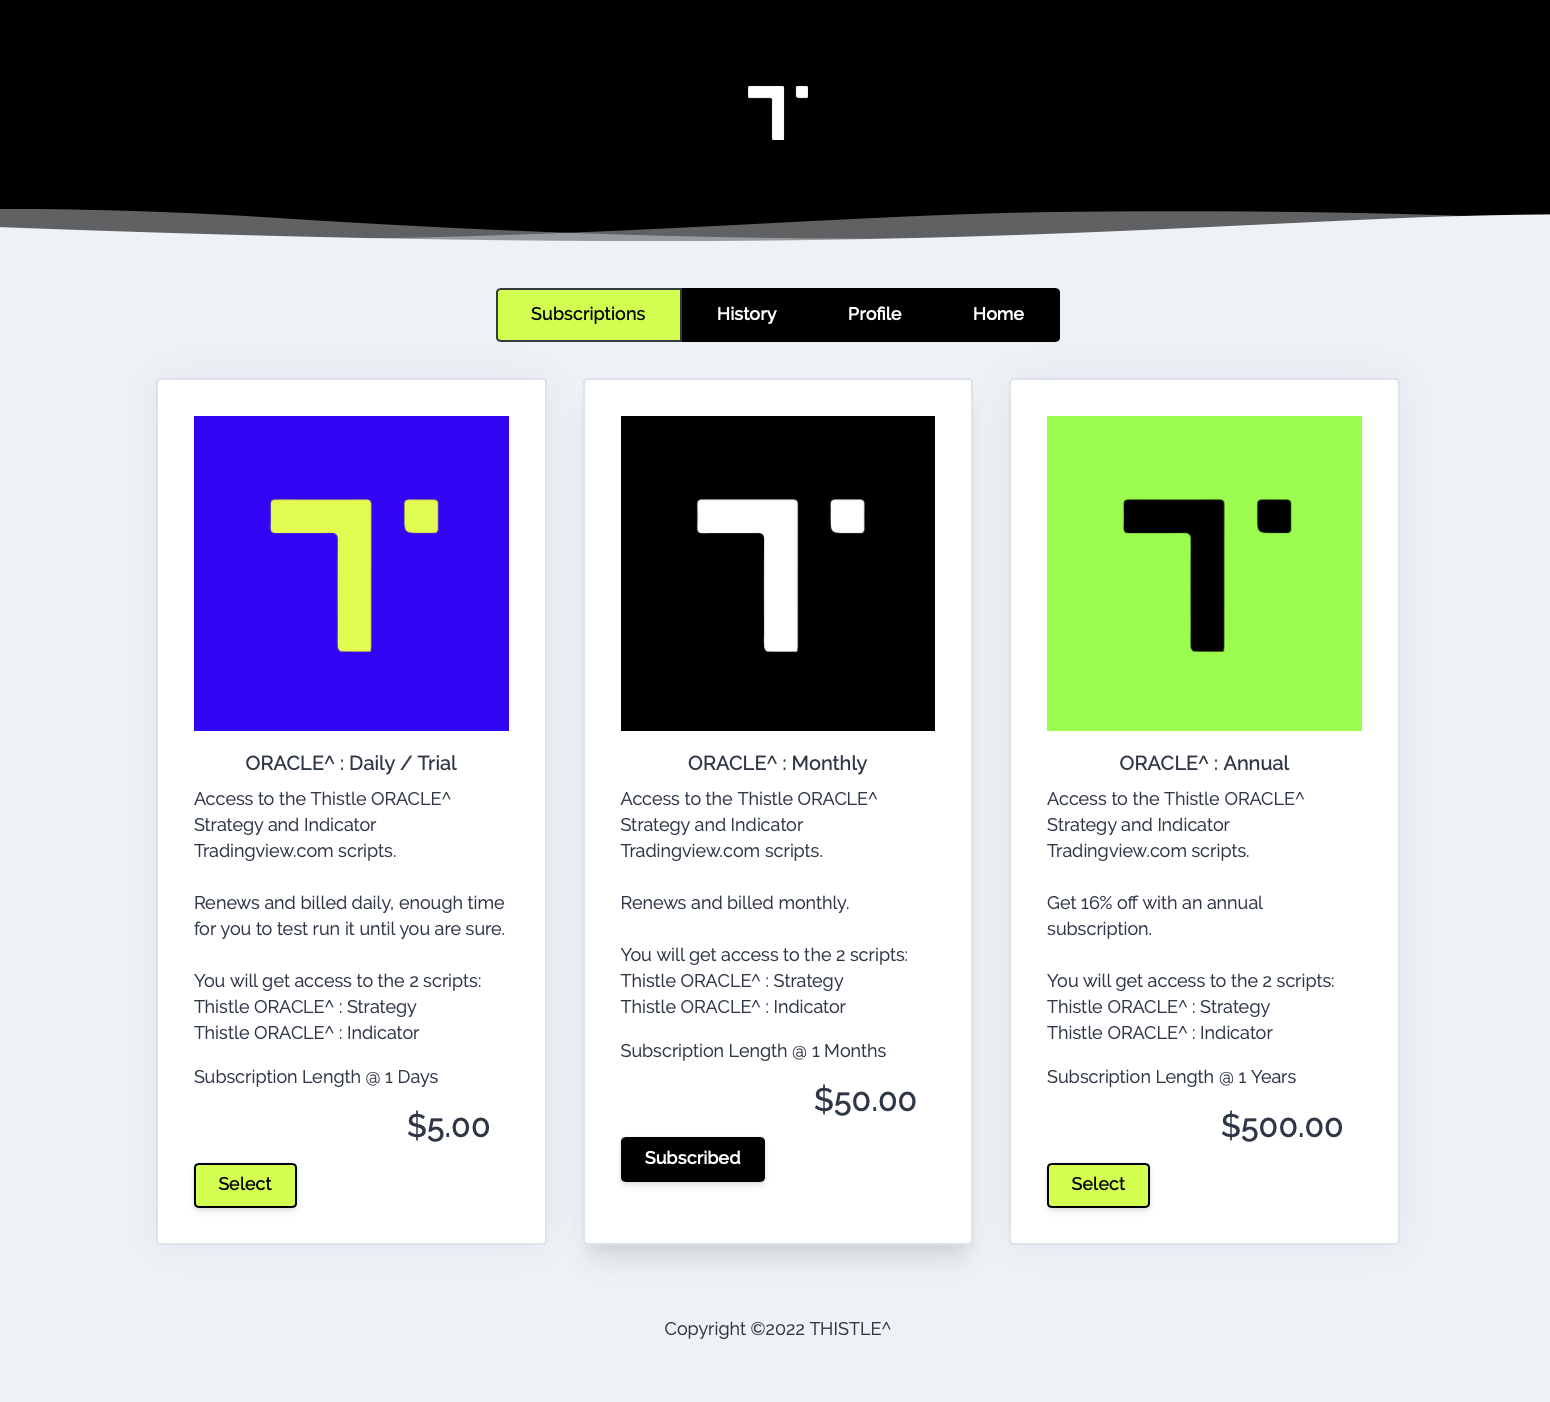
Subscribe
Select Package
Signup, choose a Subscription and pay for the daily, monthly or annual recurring packages.
Pay
Once you subscribe your packages will auto renew at expiry.
You can manage your subscription renewal status in your account "Profile" section.
Your script access is only removed if your subscription expires.
Wait for Access
Please allow 12-24hrs for our team to grant you access to the scripts on Tradingview.com, this is because they do not provide automation APIs, so we have to manually approve your access to your purchased scripts.
Add to Charts
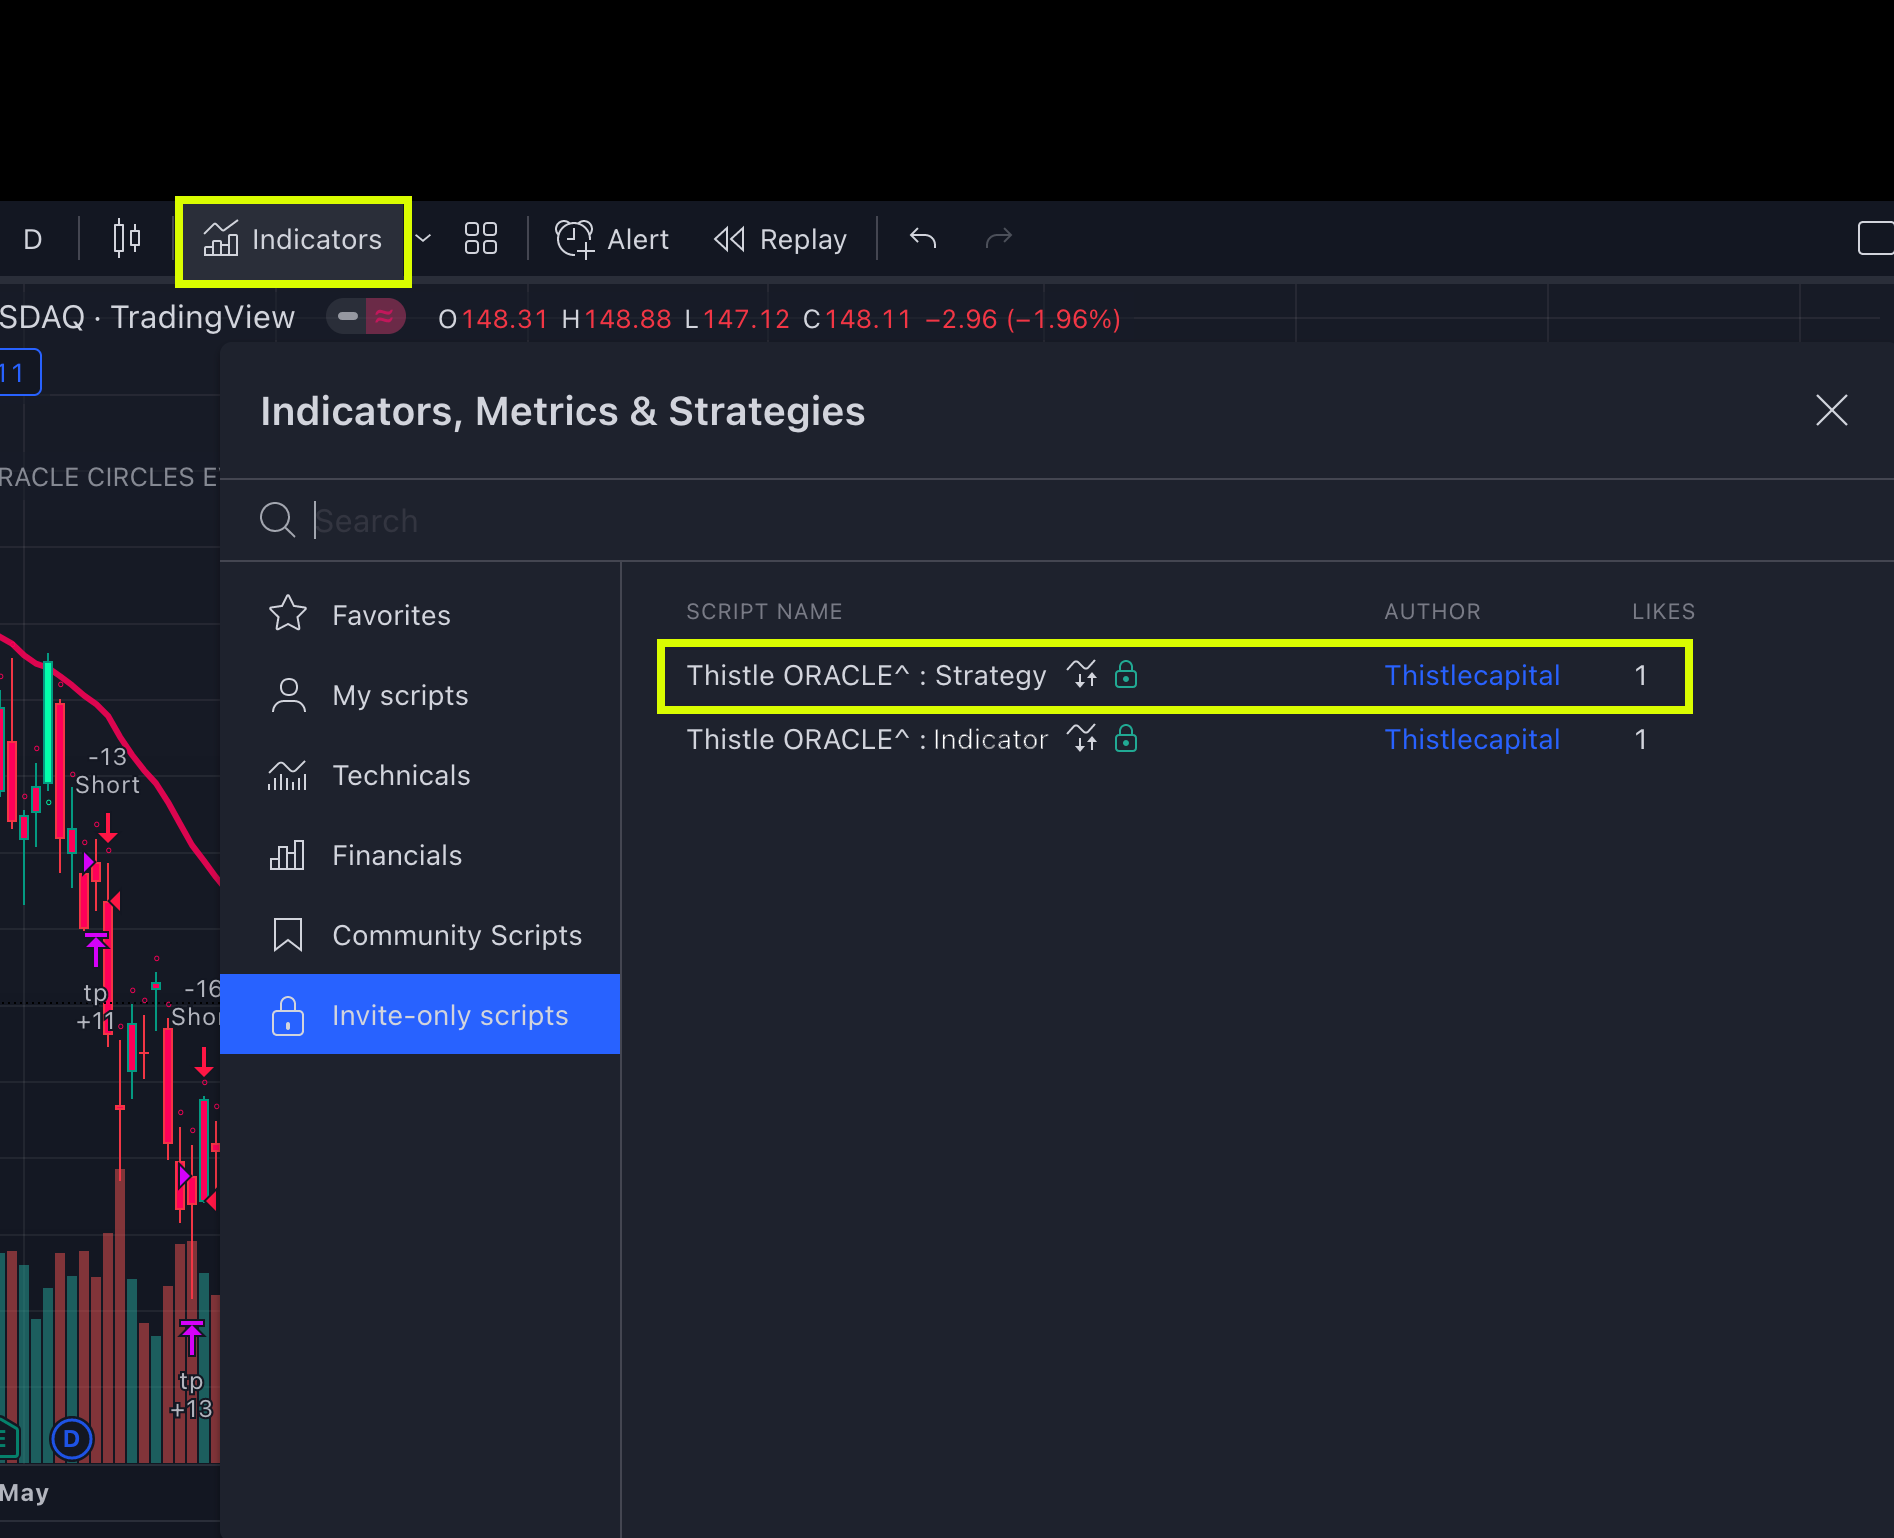
Find Scripts
On Tradingview charts page, click on INDICATORS on the header and go to the INVITE-ONLY SCRIPTS
Add Script
Search for THISTLE and add the two scripts by "Thistlecapital" below:
THISTLE ORACLE^ : Strategy
THISTLE ORACLE^ : Indicator
We suggest viewing only one at a time and using the "eye" symbol on Tradingview.com on the right of the script name to turn it off on the visible chart.
We recommend using only our INDICATOR for general use:
I^ Thistle ORACLE^
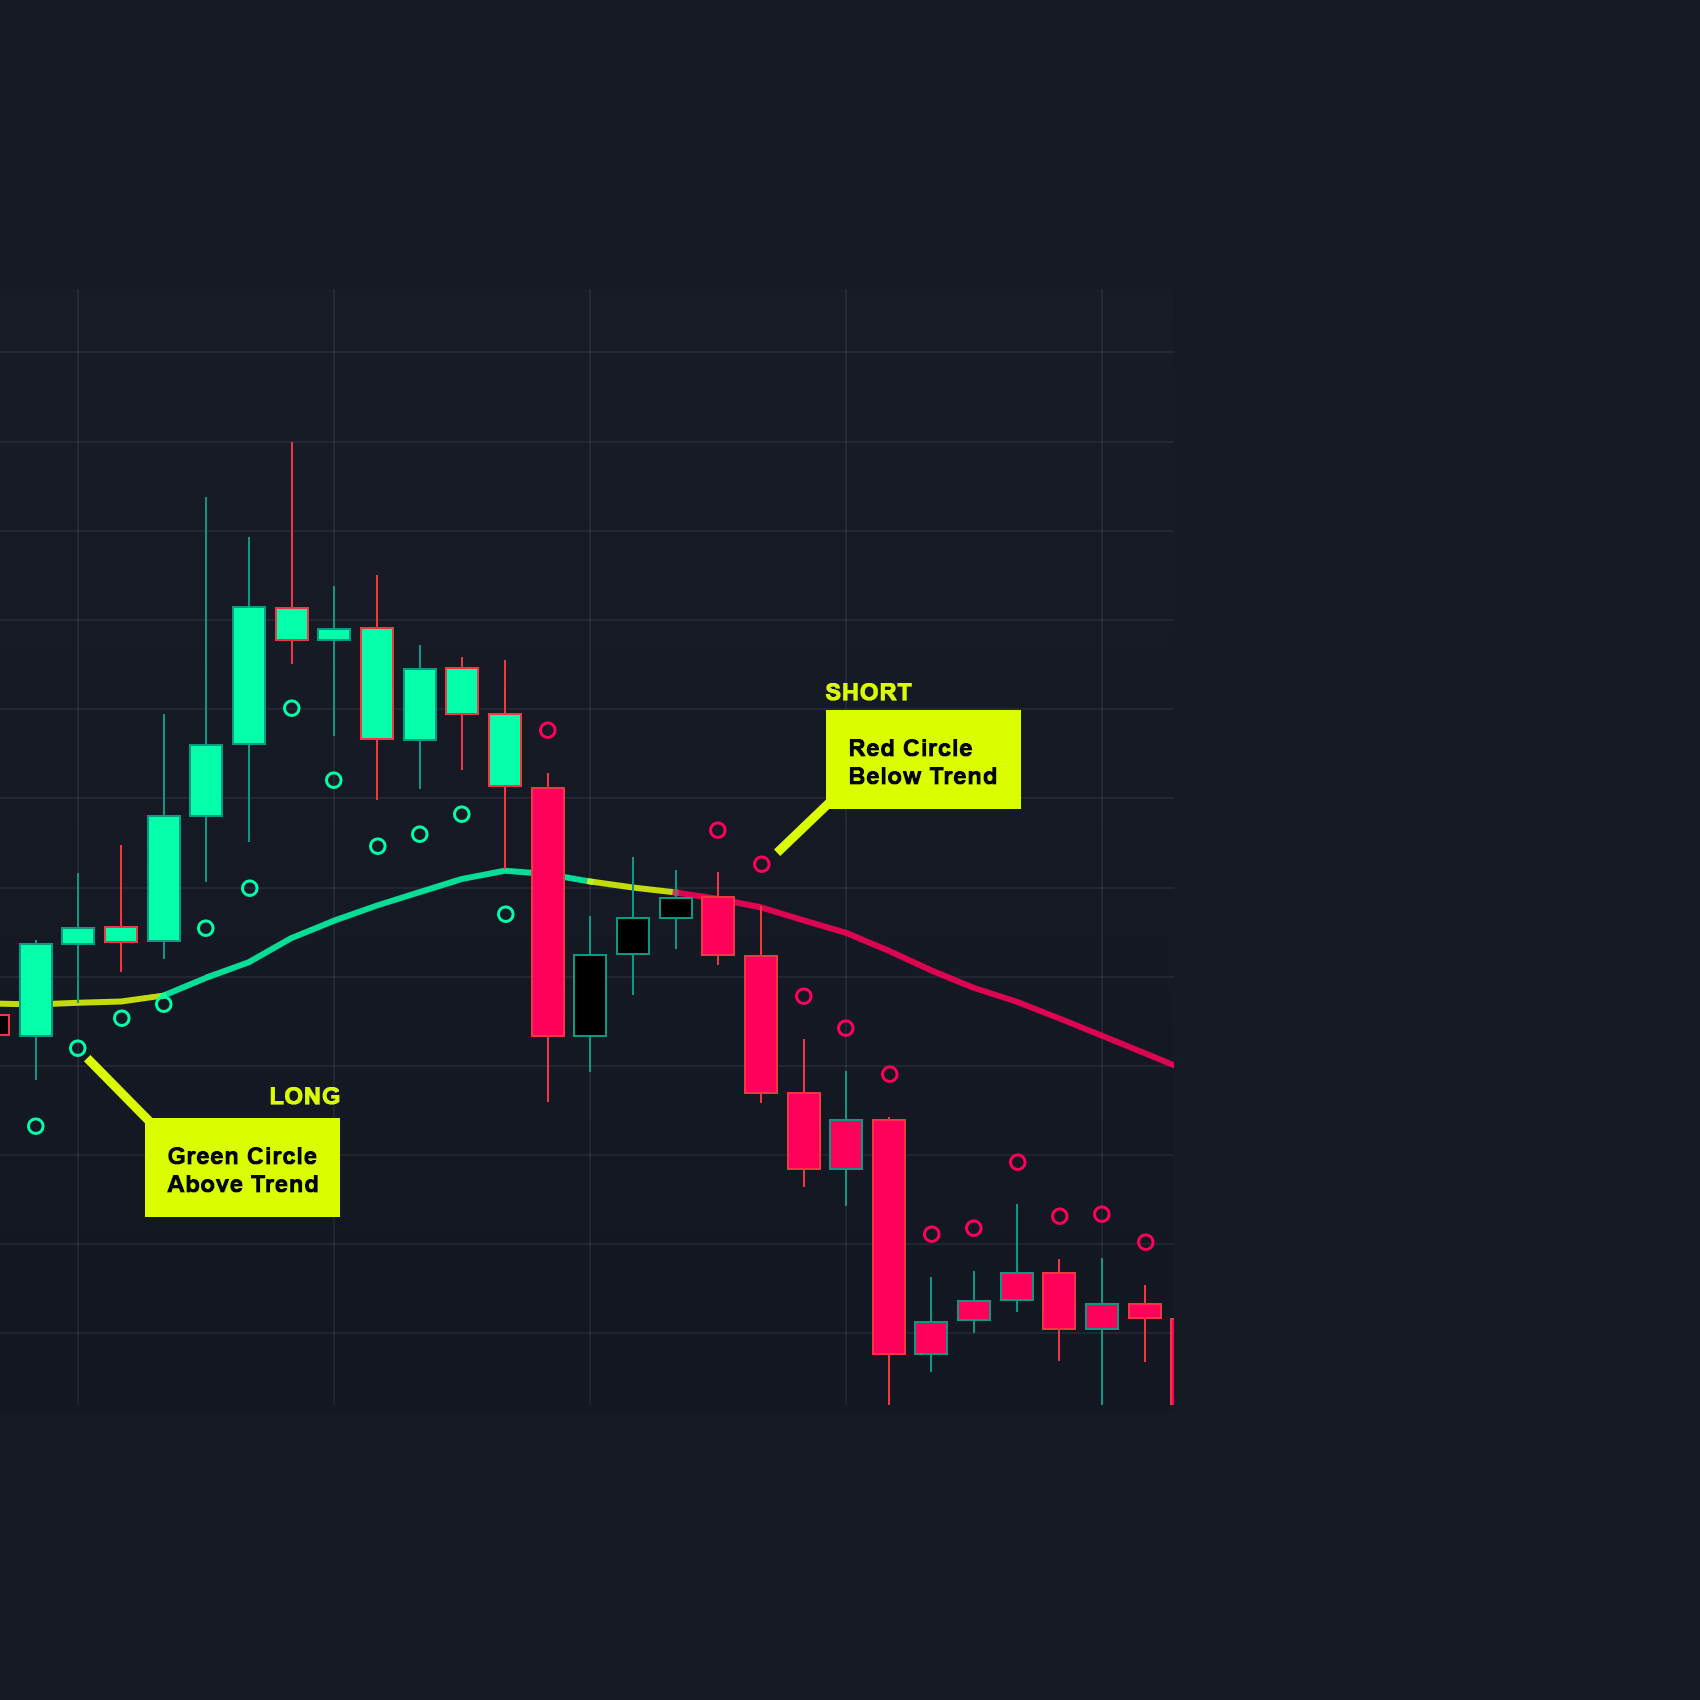
ORACLE^ Circles
Green Circle
Candle in daily range is Bullish, a sustained run of 3 green circles is a strong bullish sign. Wait for candle close above Trend line for confidence. (1 circle is enough as a direction indicator for the Daily timeframe chart)
Red Circle
Candle in daily range is Bearish, a sustained run of 3 red circles is a strong bearish sign. Wait for candle close below Trend line for confidence. (1 circle is enough as a direction indicator for the Daily timeframe chart)
Black Candle
Candle in daily range is indecisive, wait to open or close open positions until you get a change in color or continuation of the trend.
Timeframes
Works on all timeframes:
- Scalpers use 3m to 15m charts;
- Swing traders use 1H, and D charts;
- HODLers use 3D and weekly charts;
We recommend:
- Daily 1D chart to achieve 2-4% profit targets.
See our "Tested Trading Tip" at the end of this page;
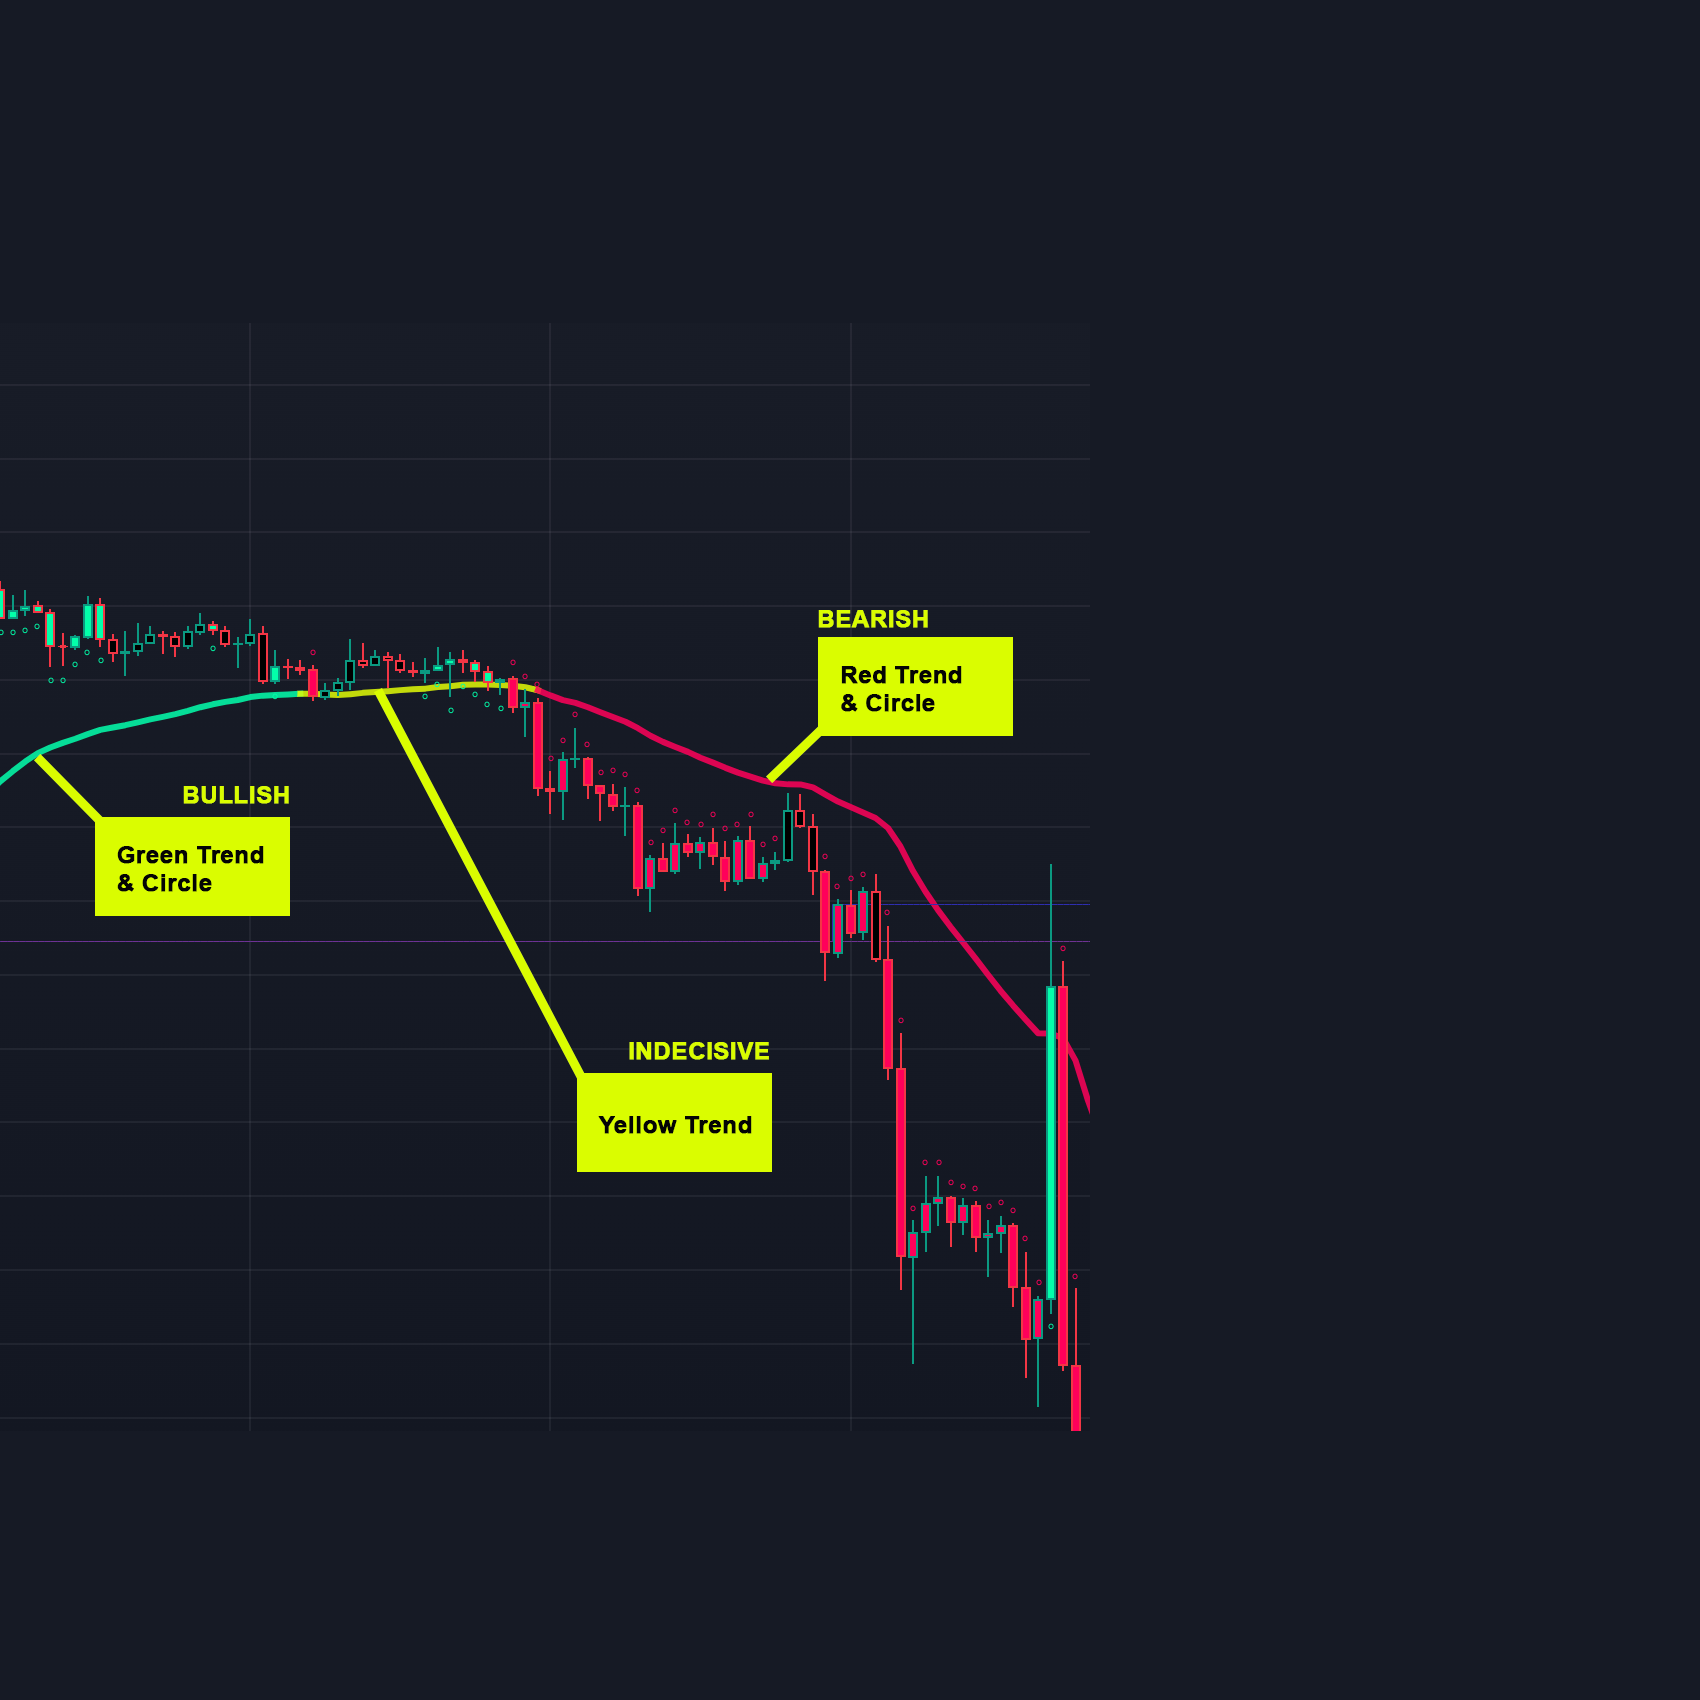
ORACLE^ Trend Line
Green Trend
Market direction in macro time range is Bullish, try to only buy dips and dumps after exhaustion. Go long once green circles start.
Red Trend
Market direction in macro time range is generally Bearish, try to only sell top of the range and exhaustions of price pumps. Go short once green red start.
Yellow Trend
Market in macro time range is indecisive, wait for circles and trend color to change before opening trades.
Use with Circles
Use in combination with circles for best trade entries.
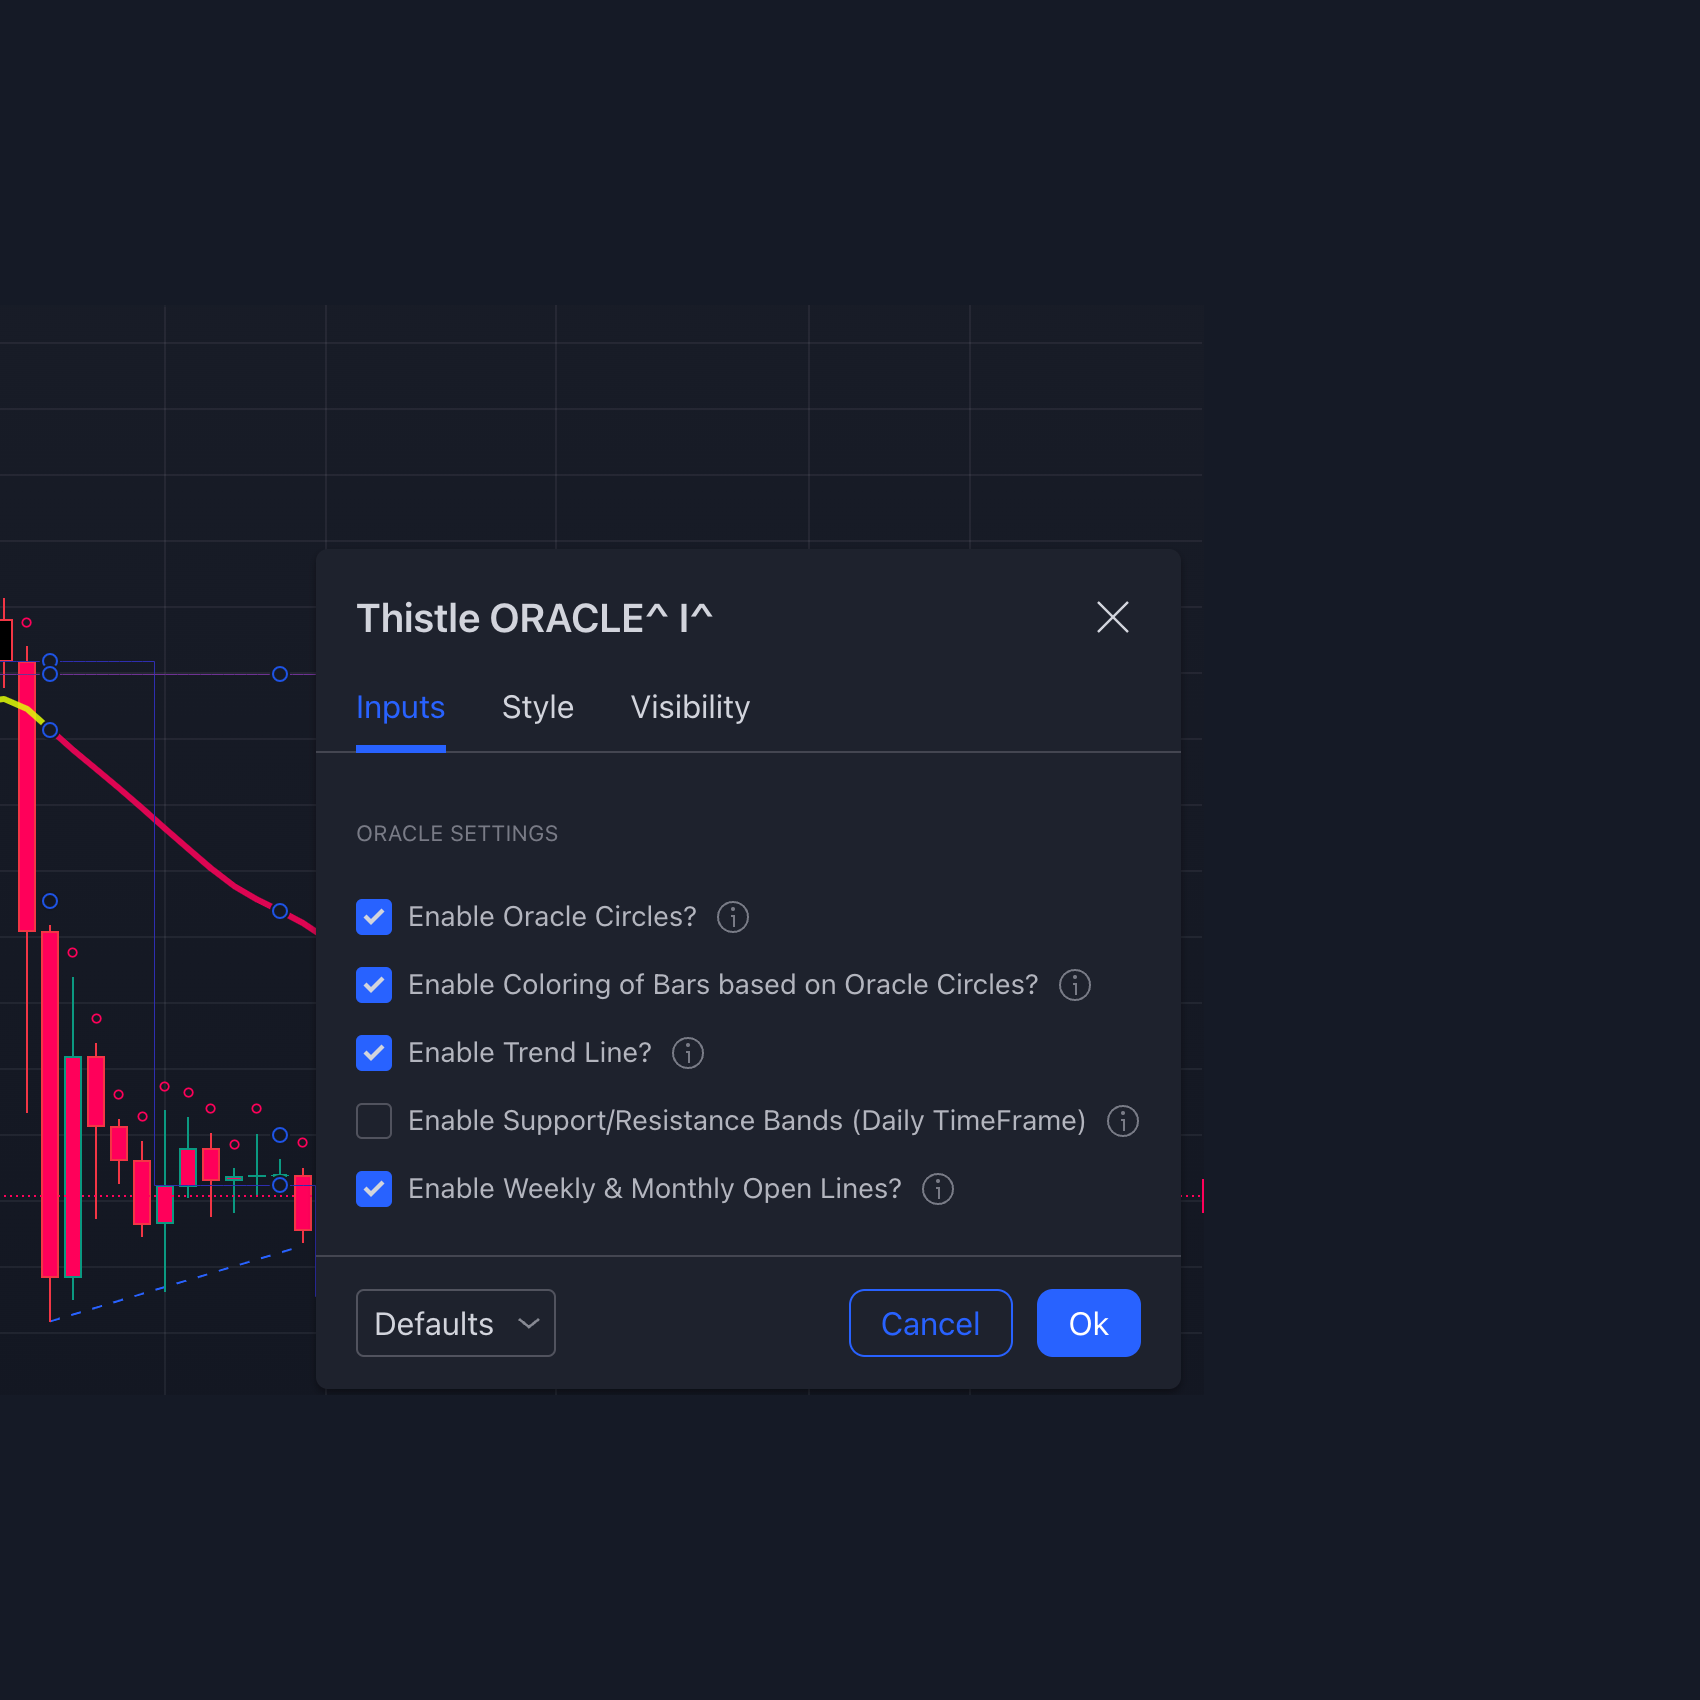
ORACLE^ : INDICATOR Settings
Enable Oracle Circles?
This displays the Oracle Circles on the chart.
Enable Coloring of Bars based on Oracle Circles?
This colors the bars to make it easier to visually see the Oracle Circles Trends.
Enable Trend Line?
This shows the overall trend momentum line to give you a strong indication on where the market is going.
Enable Support/Resistance Bands (Daily TimeFrame)?
An additional too to gauge the potential support or resistance zones.
Enable Enable Weekly & Monthly Open Lines?
An additional tool to gauge the potential market moves.
Moving Average Length
Use the moving average length you are accustomed to in trading. 200 length moving averages are very strong market indicators for bullish or bearish bounce zones especially on the Daily chart.
You can choose between SMA, EMA, WMA, TMA, VAR, WWMA, ZLEMA, TSF
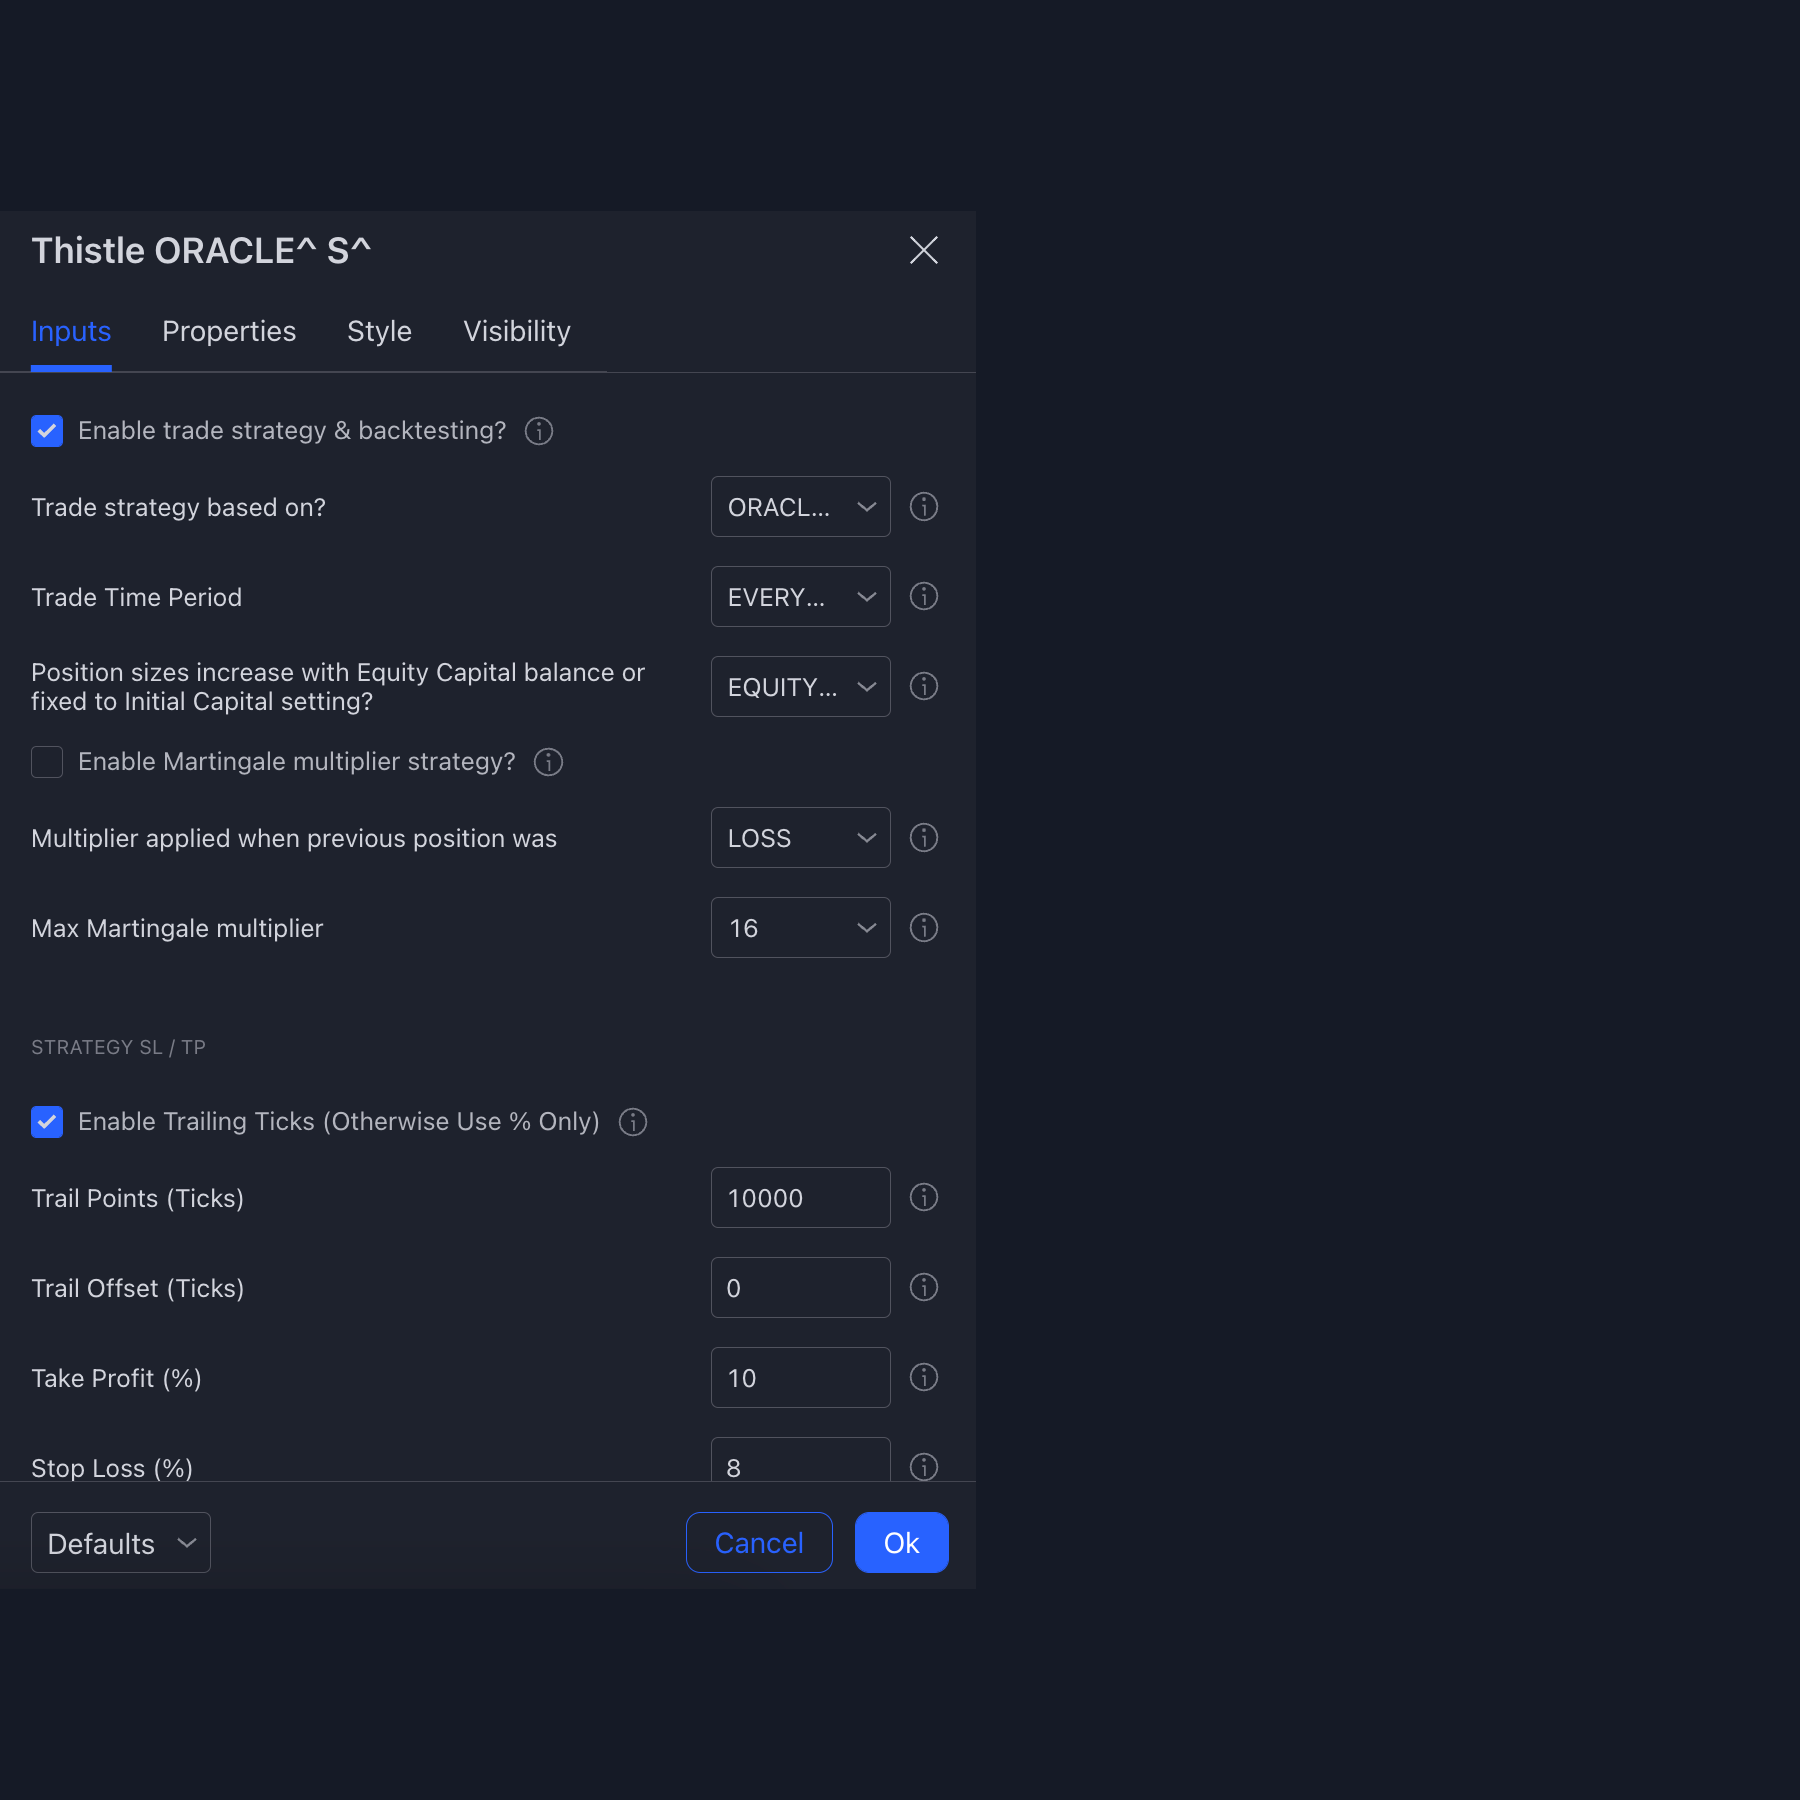
ORACLE^ : STRATEGY Settings
Strategy Settings
Enable trade strategy & backtesting?
This enables the strategy and can send alert, whilst showing you backtesting results for testing.
Trade strategy based on?
ORACLE CIRCLES or TREND LINE: Bullish or Bearish Signals are sent based on either Oracle Circles or the change of color of Oracle Trend Line
Trade Time Period
EVERYDAY, WEEKENDS or WEEKDAYS: Limit trades to a specific period.
Position sizes increase with Equity Capital balance or fixed to Initial Capital setting?
EQUITY BALANCE or INITIAL CAPITAL: This allows the strategy to use the position sizes based on your equity balance and hence will increase positons as you make more profit. The 'Order Size' under Properties Tab determines how much of your equity you trade each time. This setting will use that % of your equity.
Martingale Settings
Enable Martingale multiplier strategy?
This will multiply your trade positions according to your choice of a previous trade Win or Loss, by 2 times each consecutive trade until it does the opposite or max limit is reached.
Multiplier applied when previous position was
WIN, LOSS or BOTH: Martingale approach is applied after either winning or losing a trade.
Max Martingale multiplier
1,2,4,8,16,32,64 - 16384: Once this martingale max value multiplier for each subsequent position size is reached, the multiplier will return to 1 and stay there until a new previous trade result change occurs again.
Take Profit / Stop Loss Settings
Enable Trailing Ticks (Otherwise Use % Only)
One of the most effective tools to lock in profits from your trades.
Trail Points (Ticks)
Only used if Trailing ENABLED above. How many points after the strategy will take profit.
Trail Offset (Ticks)
Only used if Trailing ENABLED above. Offset the trailing ticks.
Take Profit (%)
Used whether or not the Trailing is enabled above. Takes Profit when this % is reached.
Stop Loss (%)
Only used if Trailing DISABLED above. Triggers Stop Loss when this % is reached.
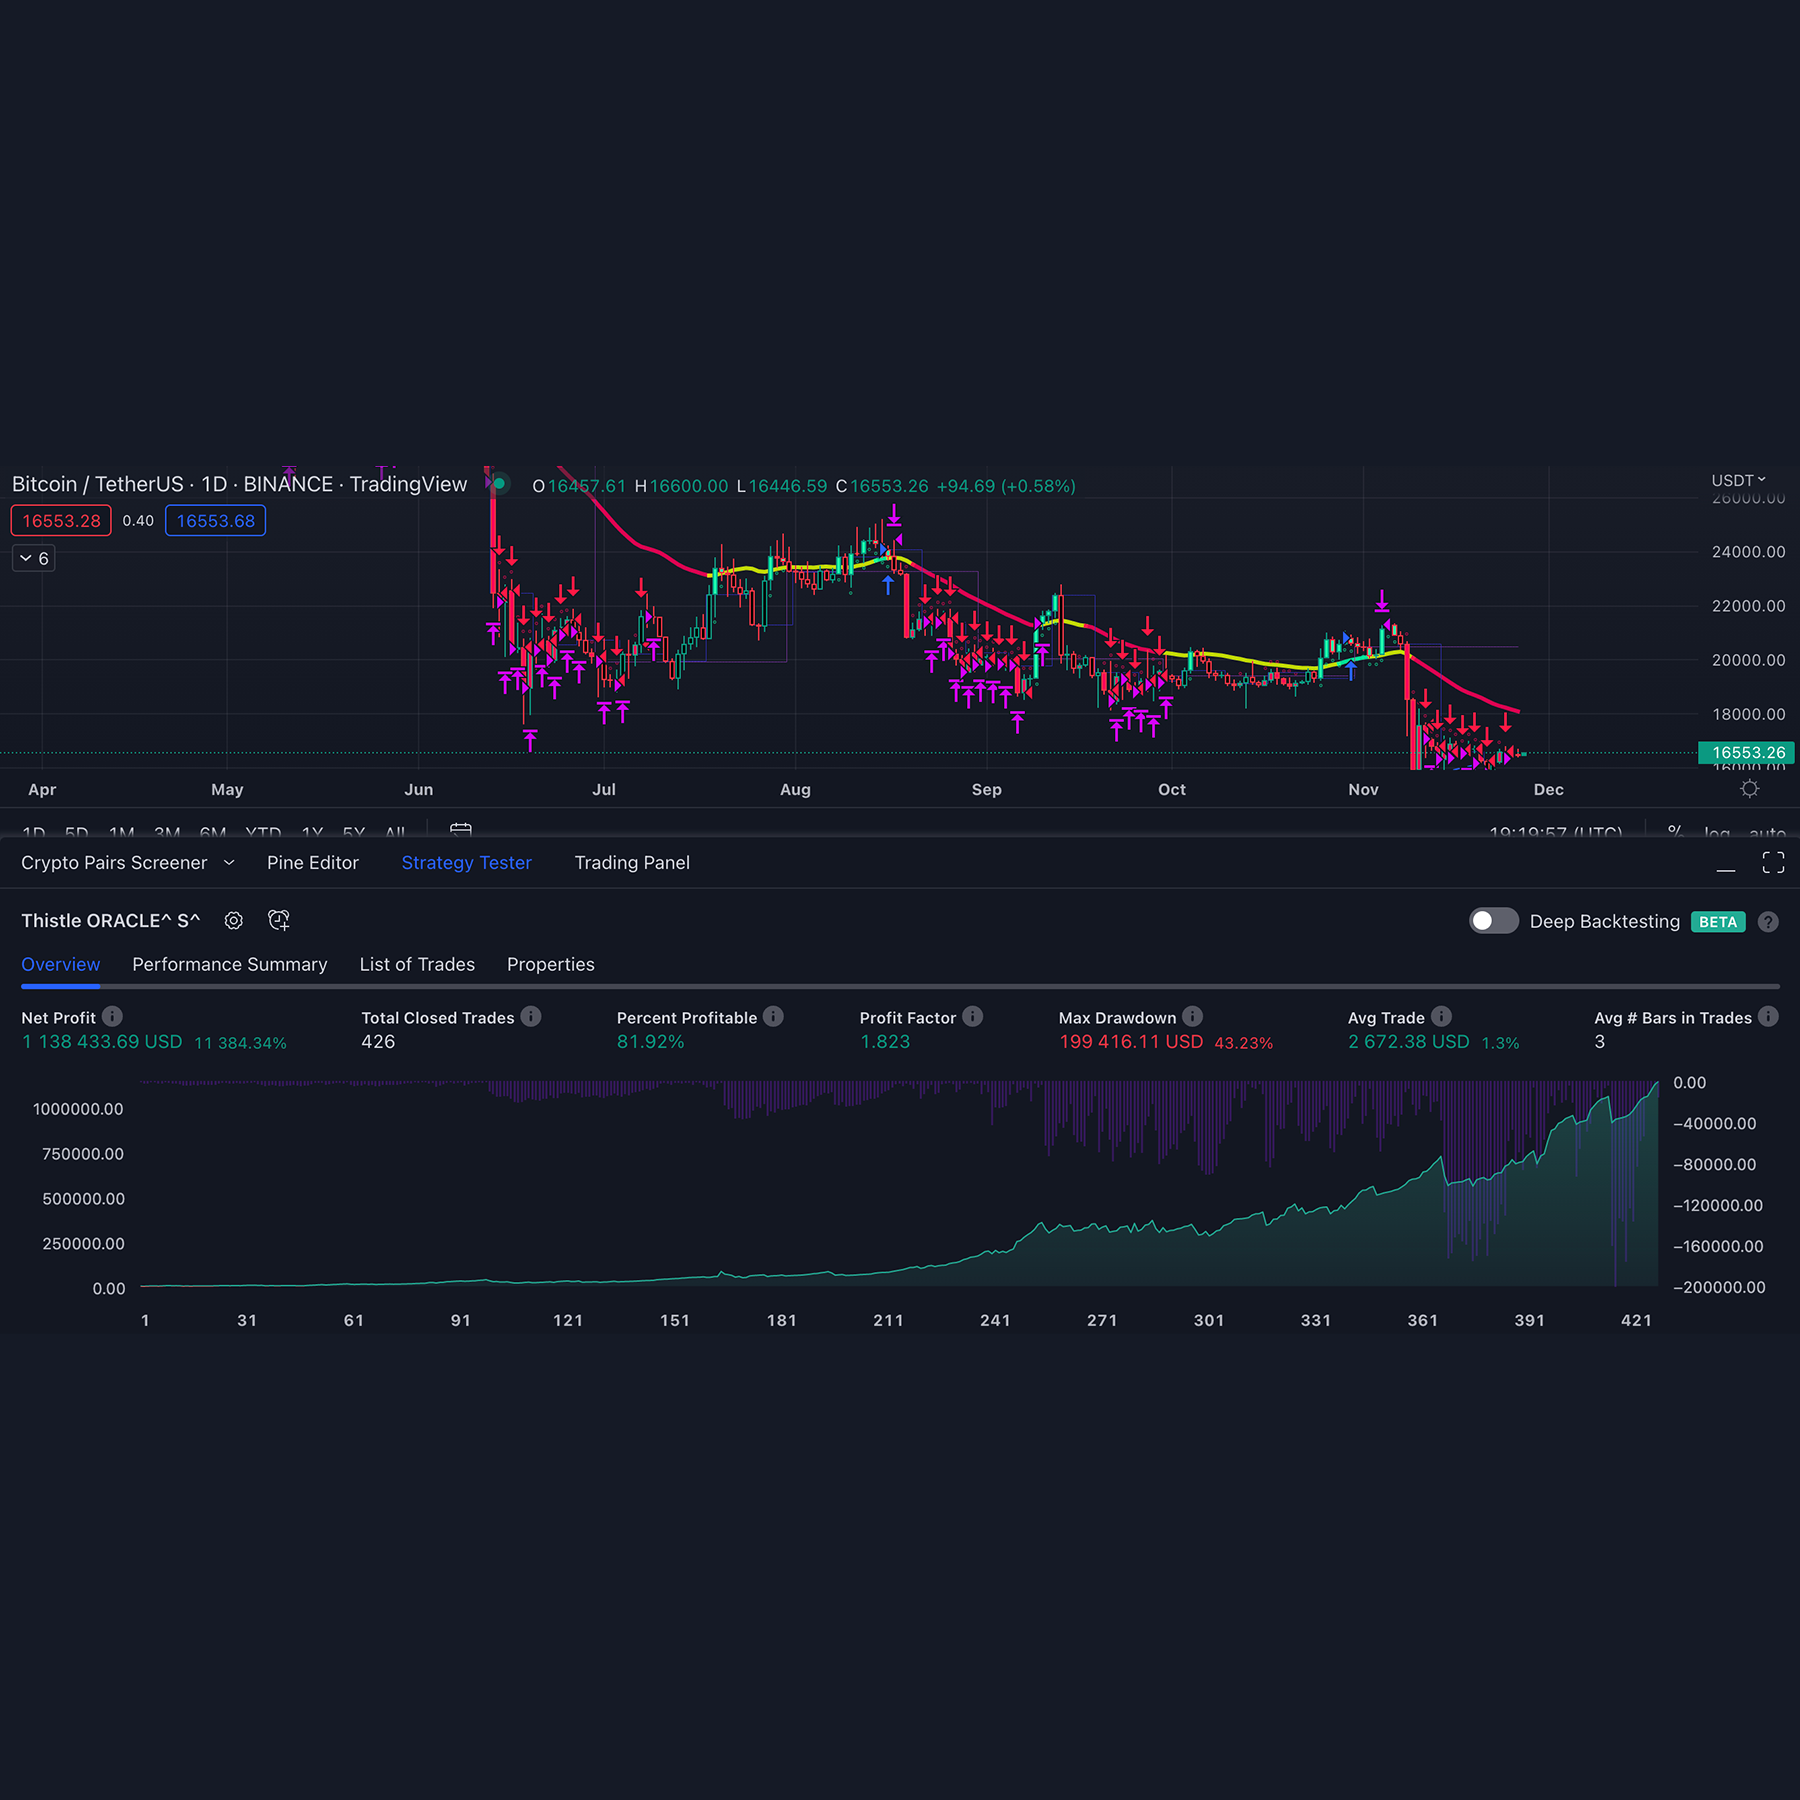
ORACLE^ : STRATEGY Backtesting
Analyse past results for better future performance.
Use our recommended parameters and test the past results with Tradingview strategy tab to identify the best settings for your chosen market symbol.
Recommendations
> 1H, D, 3D and W charts
> Activate Trailing Take Profit
> Set Take Profit as 10%
> Stop loss of 8%
> Adjust the Trailing Take Profit (PIPs) until you achieve a 4 - 6% profit range for every trade won.
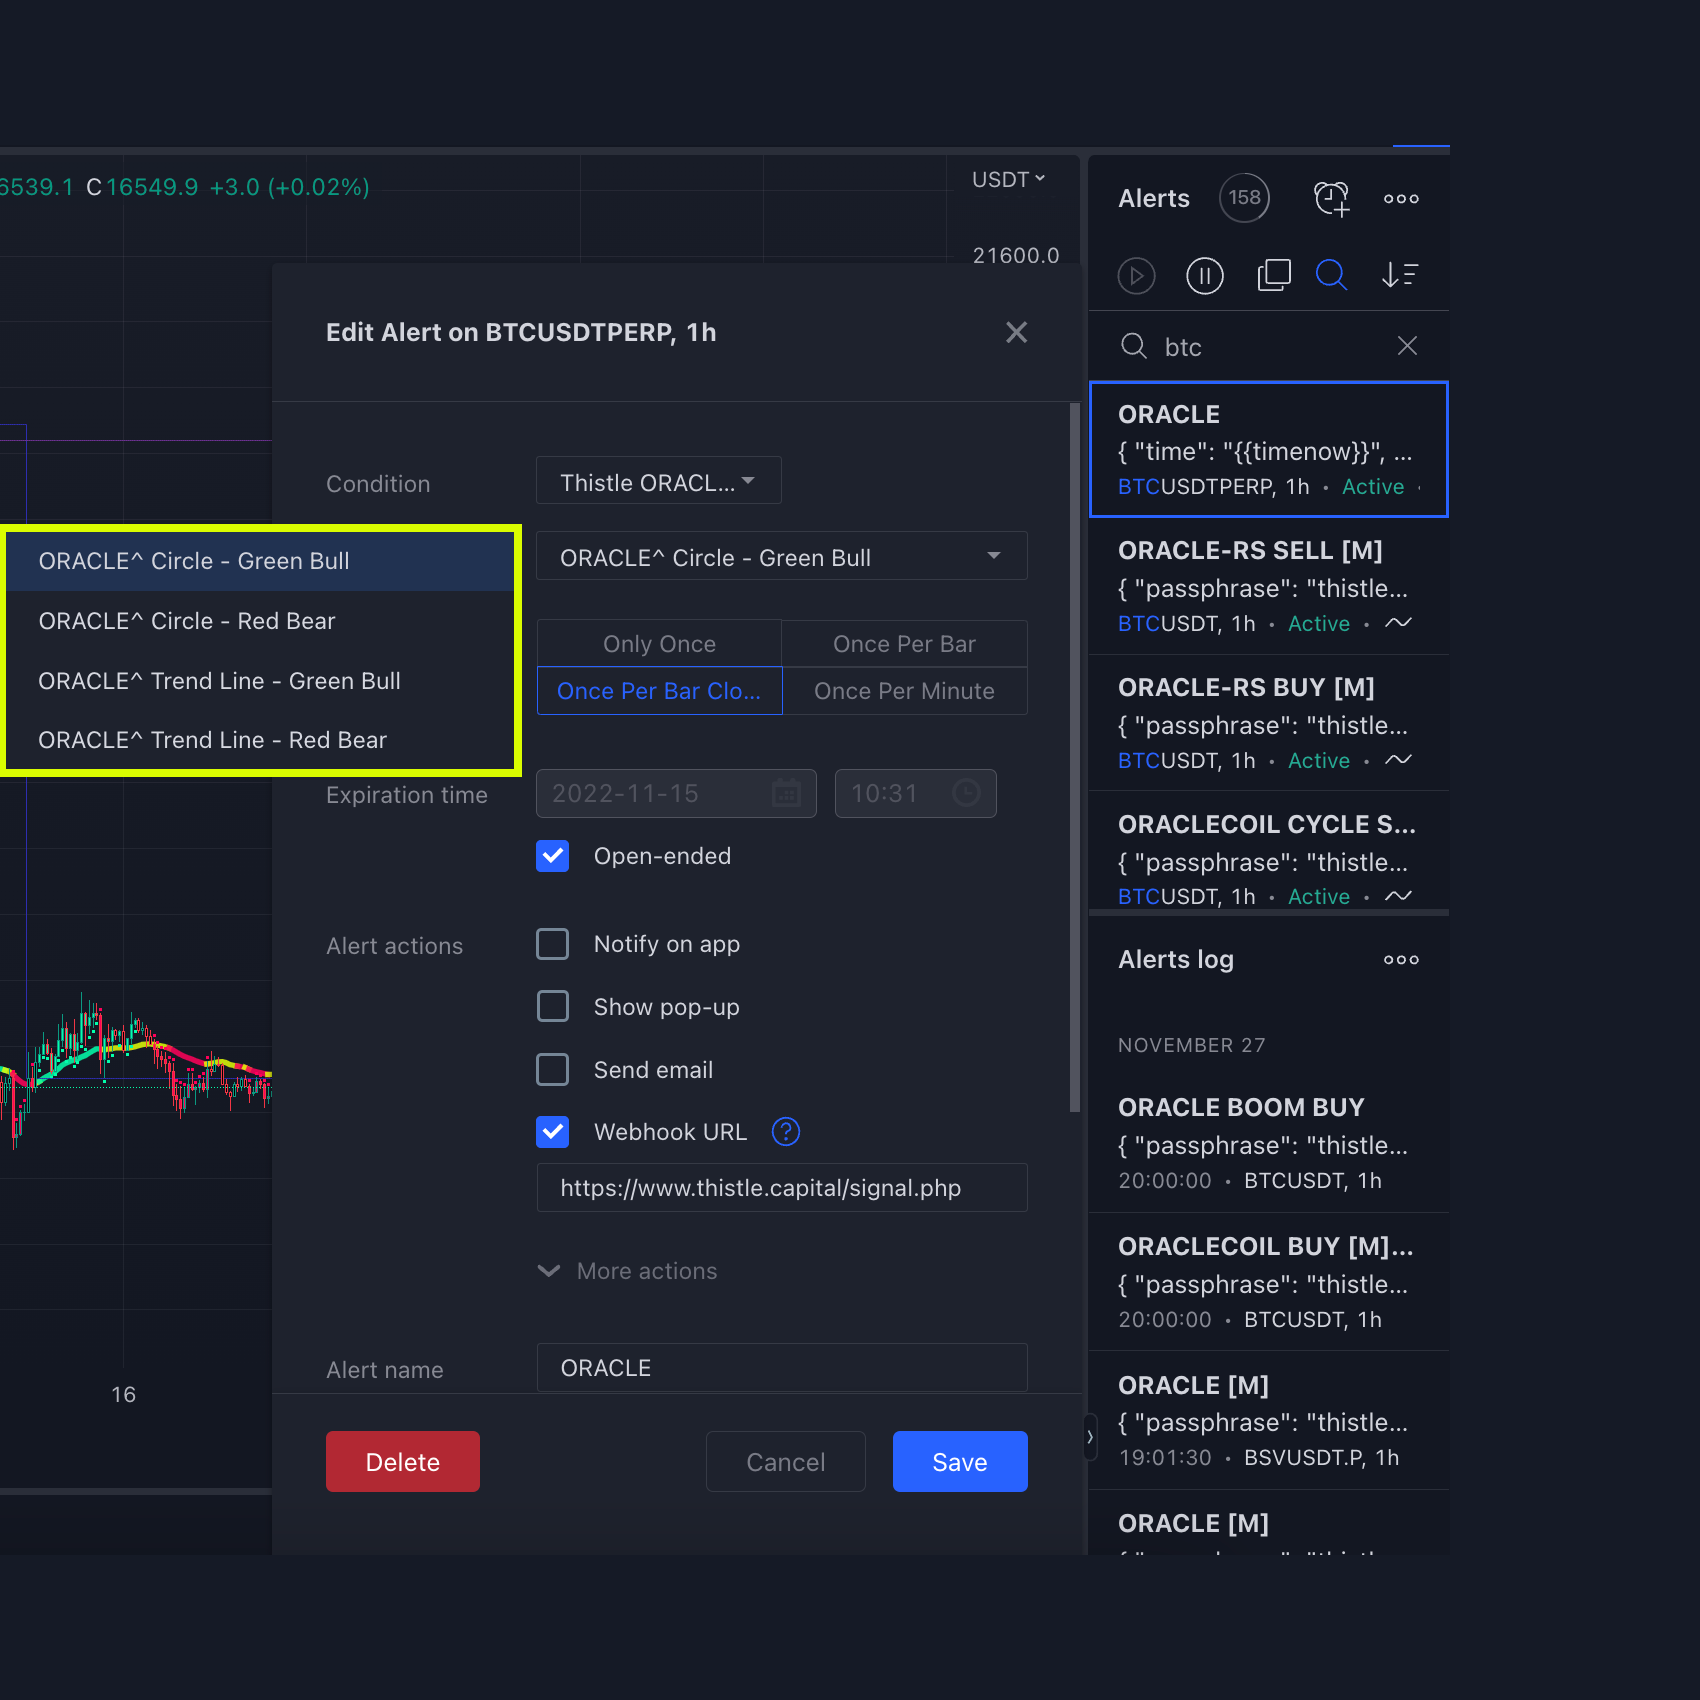
Alerts System
Automation using Tradingview.com Alerts Management
Tradingview's powerful alerts tool helps you to connect your trading decisions to third party software, servers and even just plain messaging to your devices so that you do not miss a trade again.
Json message format ready, allowing you to send coded messages to action trades automatically.
Provide Tradingview.com your server URL and a Json format message for systematic order execution and automation based on your strategy rules.
Strategy Json message example
{
	"time": "{{timenow}}",
	"exchange": "{{exchange}}",
	"ticker": "{{ticker}}",
	"order_action": "{{strategy.order.action}}",
	"comment":"{{strategy.order.comment}}",
	"bar": {
		"time":"{{time}}",
		"open": {{open}},
		"high": {{high}},
		"low": {{low}},
		"close": {{close}},
		"volume": {{volume}}
	}
}
Indicator Json message example
{
	"time": "{{timenow}}",
	"exchange": "{{exchange}}",
	"ticker": "{{ticker}}",
	"order_action": "buy / sell", //Your custom choice
	"bar": {
		"time":"{{time}}",
		"open": {{open}},
		"high": {{high}},
		"low": {{low}},
		"close": {{close}},
		"volume": {{volume}}
	}
}
Tradingview.com fills in the double curly brackets paramaters automatically when it sends the message to your server URL.